
HARTFORD, Conn. — Data released by the Connecticut Department of Public Health Monday shows a small increase in total COVID-19 hospitalizations for the first time since May 4.
There were 706 coronavirus patients in Connecticut hospitals on Sunday, according to DPH, five more than Saturday.
Connecticut's hospitalization peak was on April 22, when 1,972 people were in the hospital. The last time the number of people in the hospital was around 700 was March 31, when hospitalizations went from 608 to 766 in one day.

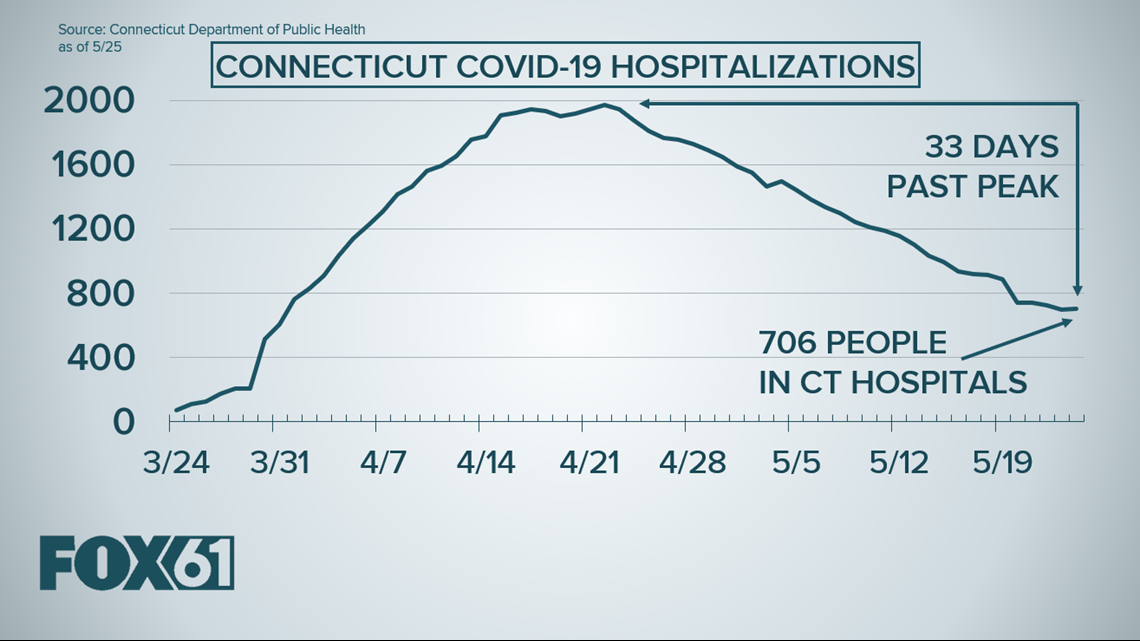
The governor and his reopening committee have pointed to total hospitalizations as the key metric because it represents the number of people sick enough to need to be in the hospital.
For example, the administration has shied away from total number of new cases because Increased testing could lead to a higher number of positive cases, when those cases may be people who are asymptomatic and not needing treatment.
Many have asked FOX61 if the hospitalization number is decreasing because people are recovering, or if the decline is attributed to deaths. Unfortunately we don't have all the data to be able to determine that.
The state has not released a regular tally of daily hospital discharges or new admissions. The DPH data team has said they are working to get that information from the Connecticut Hospital Association, but that data has yet to be posted.
Connecticut Coronavirus Deaths
The average number of daily deaths has been in a general state of decline in the last two months. For the first time since the second week of April, the seven-day average for daily deaths is below 50.
DPH reported 49 new deaths for May 24. There have been 3,742 coronavirus-related deaths in Connecticut according to DPH data.
In the graph below, we use orange highlight the dates after Connecticut's Phase One reopening on May 20. Other states have seen an increase of cases after starting the reopening process. Because patients can see symptoms a week after exposure, Connecticut likely won't know the effects of reopening until around June 1, 12 days after reopening.

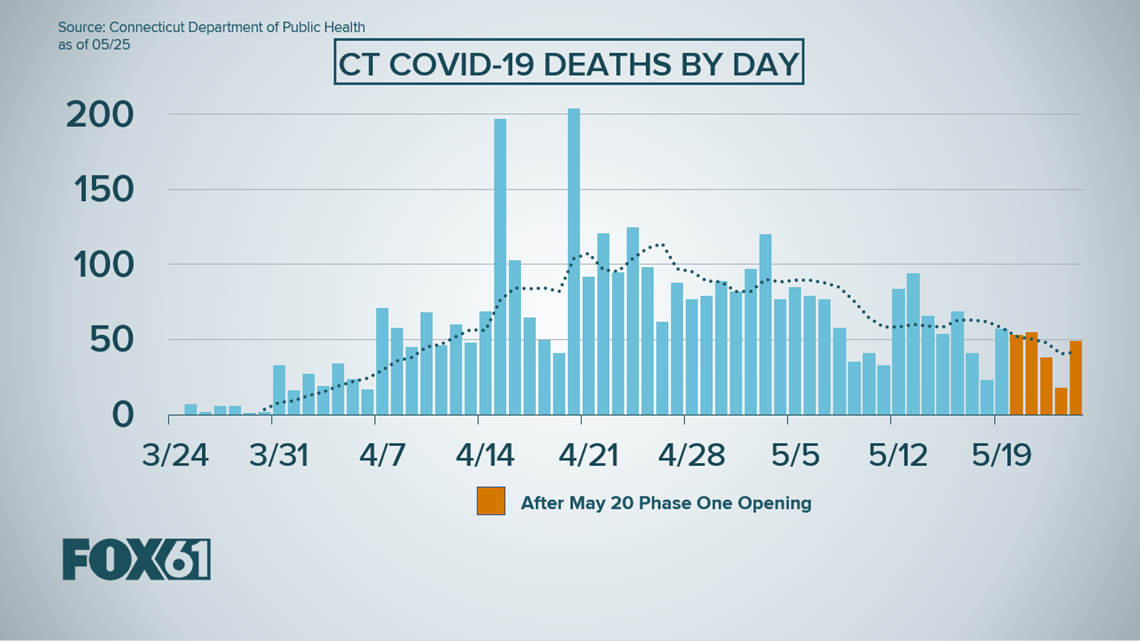
The dotted line on the graph above shows where the seven-day moving average is. That moving average has dropped from about 110 deaths per day in April to less than 50 deaths per day now.
The two big spikes in April include deaths that had gone previously unreported.
Testing
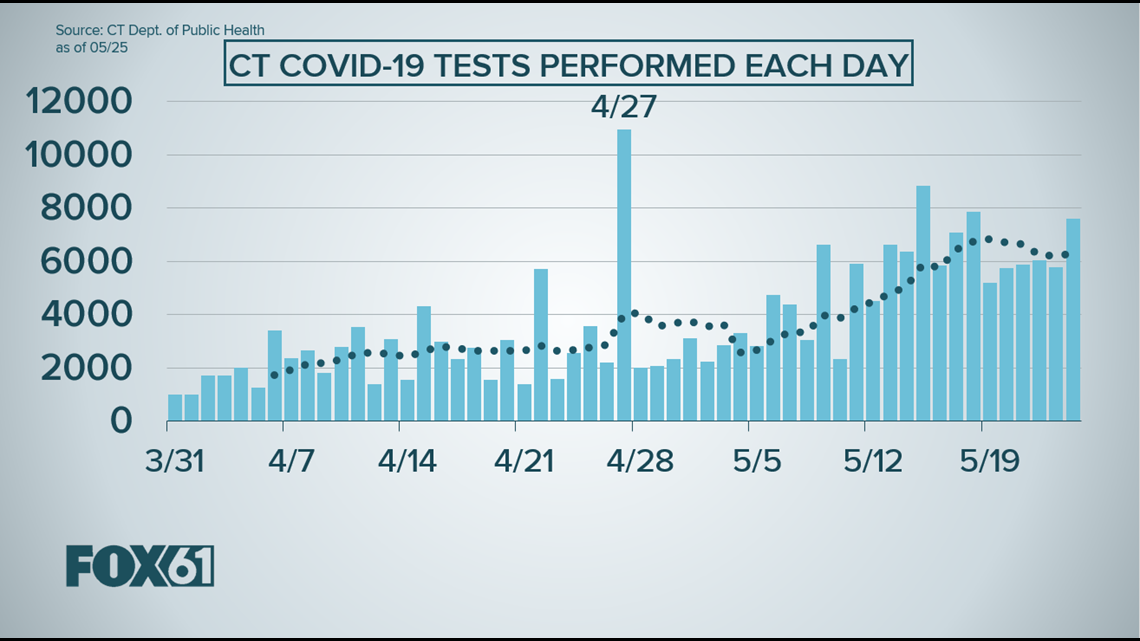
One of the criteria for reopening was to dramatically increase testing in Connecticut. The goal is to get front-line workers and asymptomatic people tested. The good news is that testing has been steadily increasing since the beginning of May.
Connecticut surpassed 200,000 tests performed on Friday. On Monday, DPH reported 221,726 tests performed in Connecticut to date.
The seven-day average for tests completed peaked on May 18th at around 7,000 tests per day. On Monday that average was closer to 6,000.

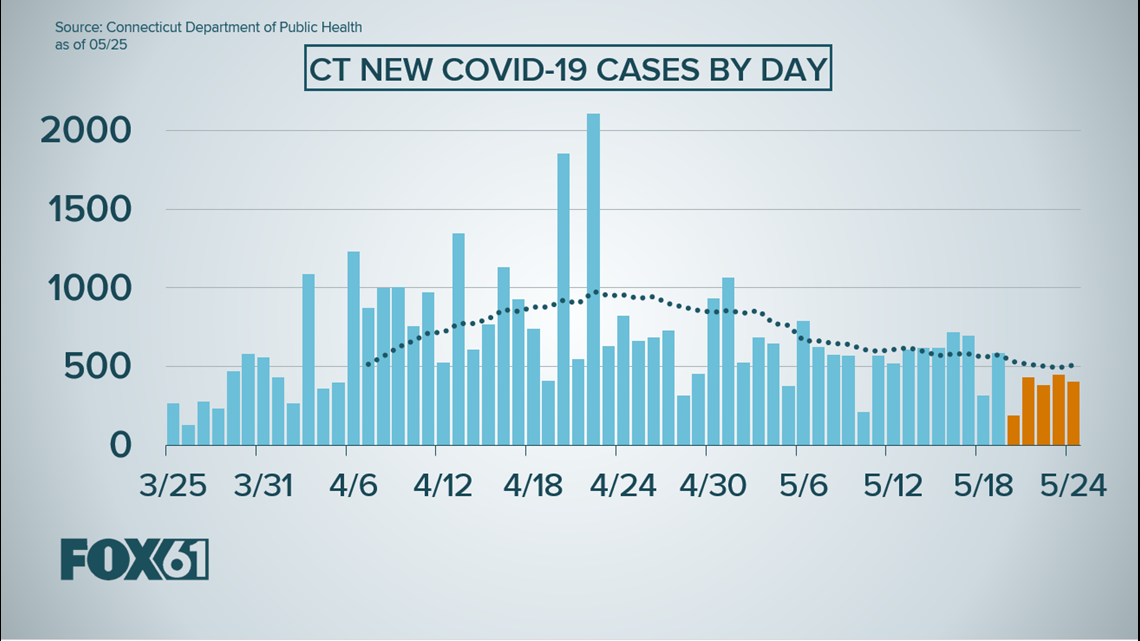
The ramping up of testing could lead to a higher number of cases. But in Connecticut, even as testing increases dramatically, the number of new cases has remained generally flat.

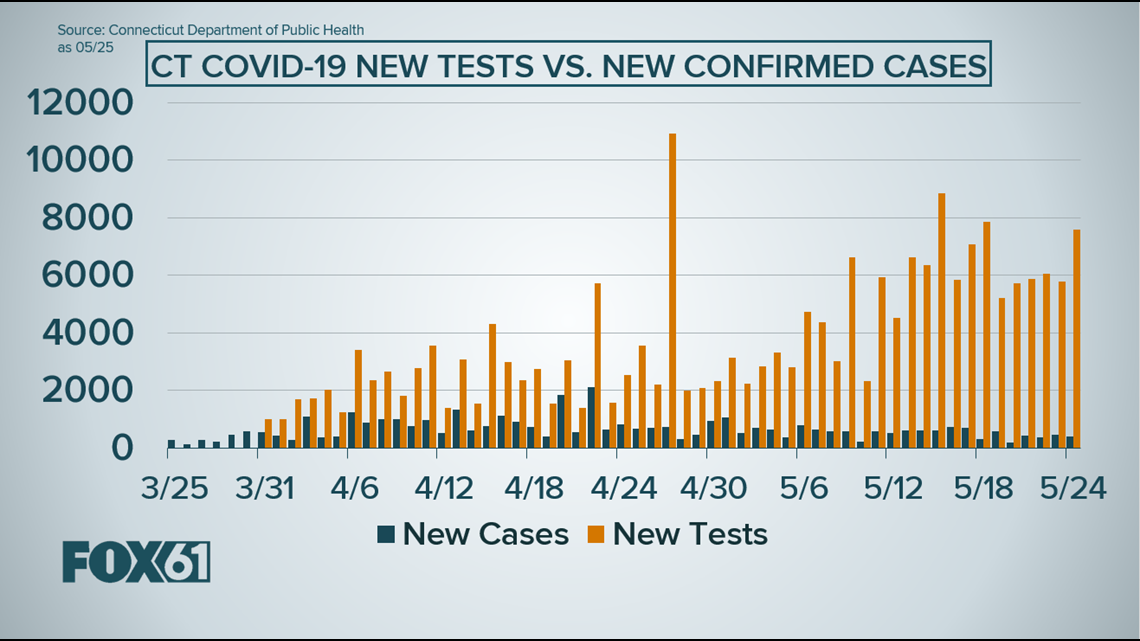
The current seven-day average for new cases has been sitting at around 500 new cases a day. The graph below uses orange to highlight the days after Phase One reopening in Connecticut.